Scope 3 emissions
Scope 3 emissions are not produced by the company itself, and are not the result of activities from assets owned or controlled by Elopak, but by those we are indirectly responsible for, up and down our value chain. Scope 3 emissions include all sources not within the scope 1 and 2 boundaries. A lifecycle approach to the value chain is important to ensure that all emissions related to our products are included.
The different categories for scope 3 emissions are presented and described in the methodology chapter, read more here. All categories are estimated and reported in the data tables. In addition, we highlight the categories included in the scope of our Science Based Targets. They are the most important categories within which Elopak can make an impact through both internal measures and through value chain collaboration.
The categories included in our Science Based Targets are: raw materials, business travel, transport and distribution, and filling machines in operation.
In 2022, our scope 3 emissions for the categories included in the scope of our Science Based Targets were reduced by 8% compared to 2020. Our total scope 3 emissions were reduced by 7% compared to 2020.
Carbon footprint of our cartons continue to decrease. This is due to emission reduction initiatives internally as well as at our suppliers, and because customers opt for more environmentally friendly cartons.
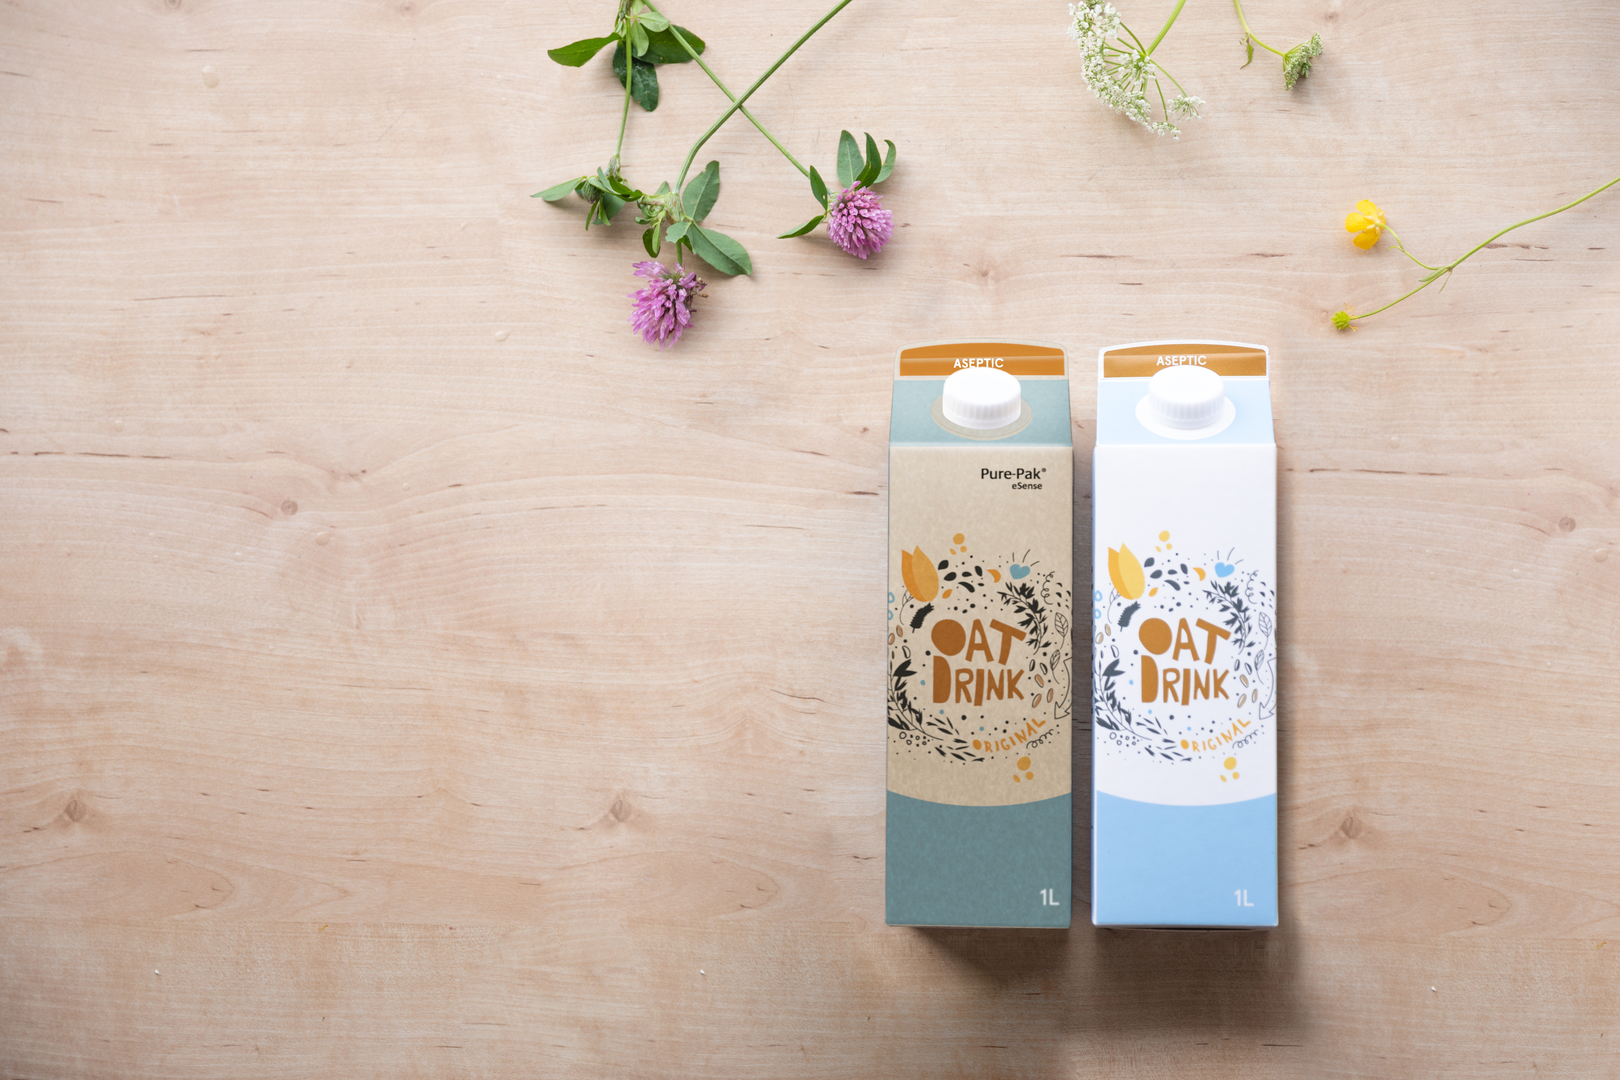
More environmentally friendly cartons include brown board as well as the use of bio-circular PE. In 2022, the volume of brown board cartons in Europe increased by 8% from 2021. Comparing carbon footprint of brown board vs white board, the 2022 volume of brown board has contributed to an emission reduction of more than 3 000 tonnes.
We are making our bio-circular offering available to a wider range of customers through introducing an approach where a smaller part of the polymers in the carton is sourced from bio-circular feedstocks. This gives a more affordable solution while still, on an overall level, reducing the use of fossil-based resources and reducing greenhouse gas emissions.
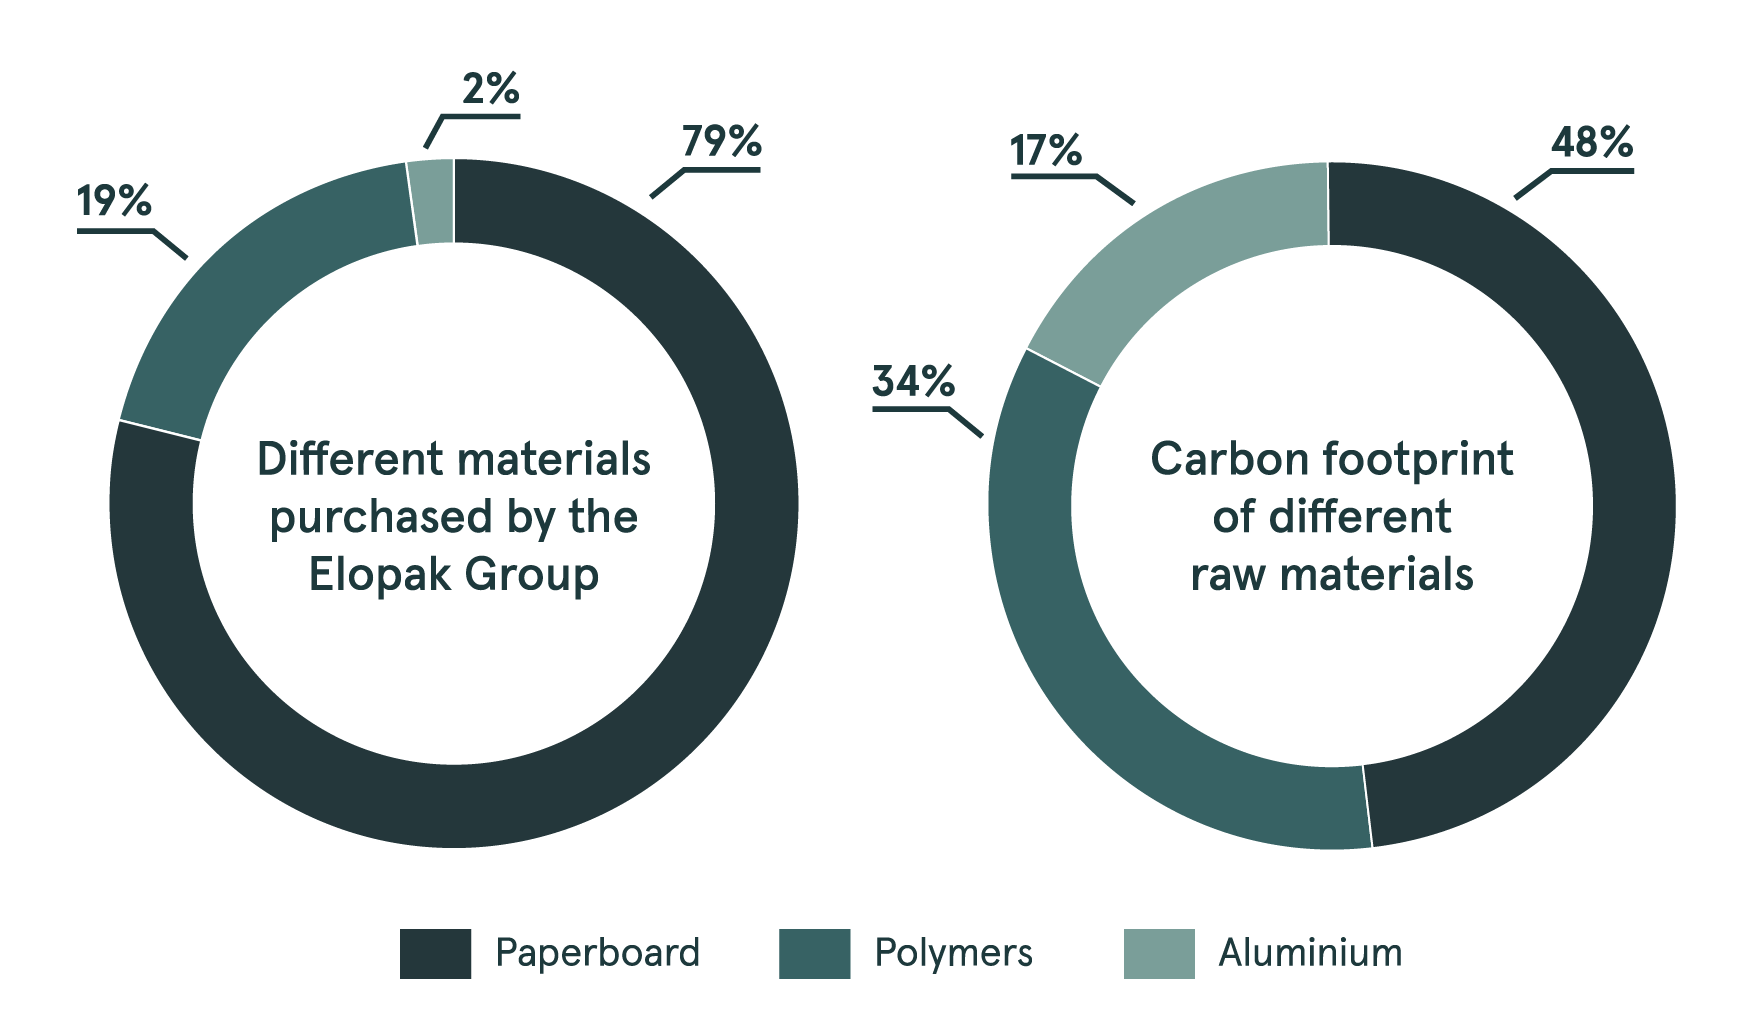
The below figure shows the main raw materials purchased by Elopak in comparison to the materials’ climate impact. Paperboard, being by far the main raw material, represents less than half of our materials’ climate impact. While aluminum only represent 2% of our raw material purchase, it represents 17% of the emissions from our raw materials.


Purchased goods and services
The main contributor to our scope 3 emissions is the raw materials used in our products. Change in emissions from year to year in this category is strongly correlated to volume development in our sold products, but also impacted by measures taken by our suppliers. The emissions from purchased goods and services included in out SBT decreased with 6% compared to the 2020 baseline. The increased share of cartons with features like renewable PE and brown board is the main factor behind this reduction.
Business travel
Emissions from business travel only accounts for 0.4% of the total scope 3 emissions. However, as our emissions are directly linked to decisions we take in our daily operations, we choose to highlight how these emissions develop and the measures we take to reduce them.
After 2 years during which Elopak’s travel activity was strongly affected by the Covid-19 pandemic, 2022 represented a year of normalization. Still, the lessons learned through the pandemic and the investments made in online meeting facilities, has resulted in less business travel compared to the situation before 2020. Elopak encourages employees to choose online meetings where possible, even after travel restrictions have been lifted.
The integration process for Elopak’s 3 new plants has generated an increased amount of long-distance travel. During 2022 we have integrated the plants in Casablanca and Dammam to our travel management system.
Elopak saw a 75% increase in emissions from business travel compared to the 2020 baseline.
Transport and distribution
Over the last few years we have initiated projects aimed at improving the fill rate of our transport system. Fill rate is measured by calculating how much of the floor space of the transport equipment we fill.
In addition to focusing on the fill rate, we have stated initiatives to obtain increased pallet load by adding extra layers of cartons per pallet.
Emissions from transport increased by 12% from 2021 to 2022, mainly due to increased volume of material transported.
High Bay Warehouse
In October we celebrated the official opening and launch of operations of Elopak’s new fully automated high-bay warehouse in Terneuzen, Netherlands.
Read morePure-Fill
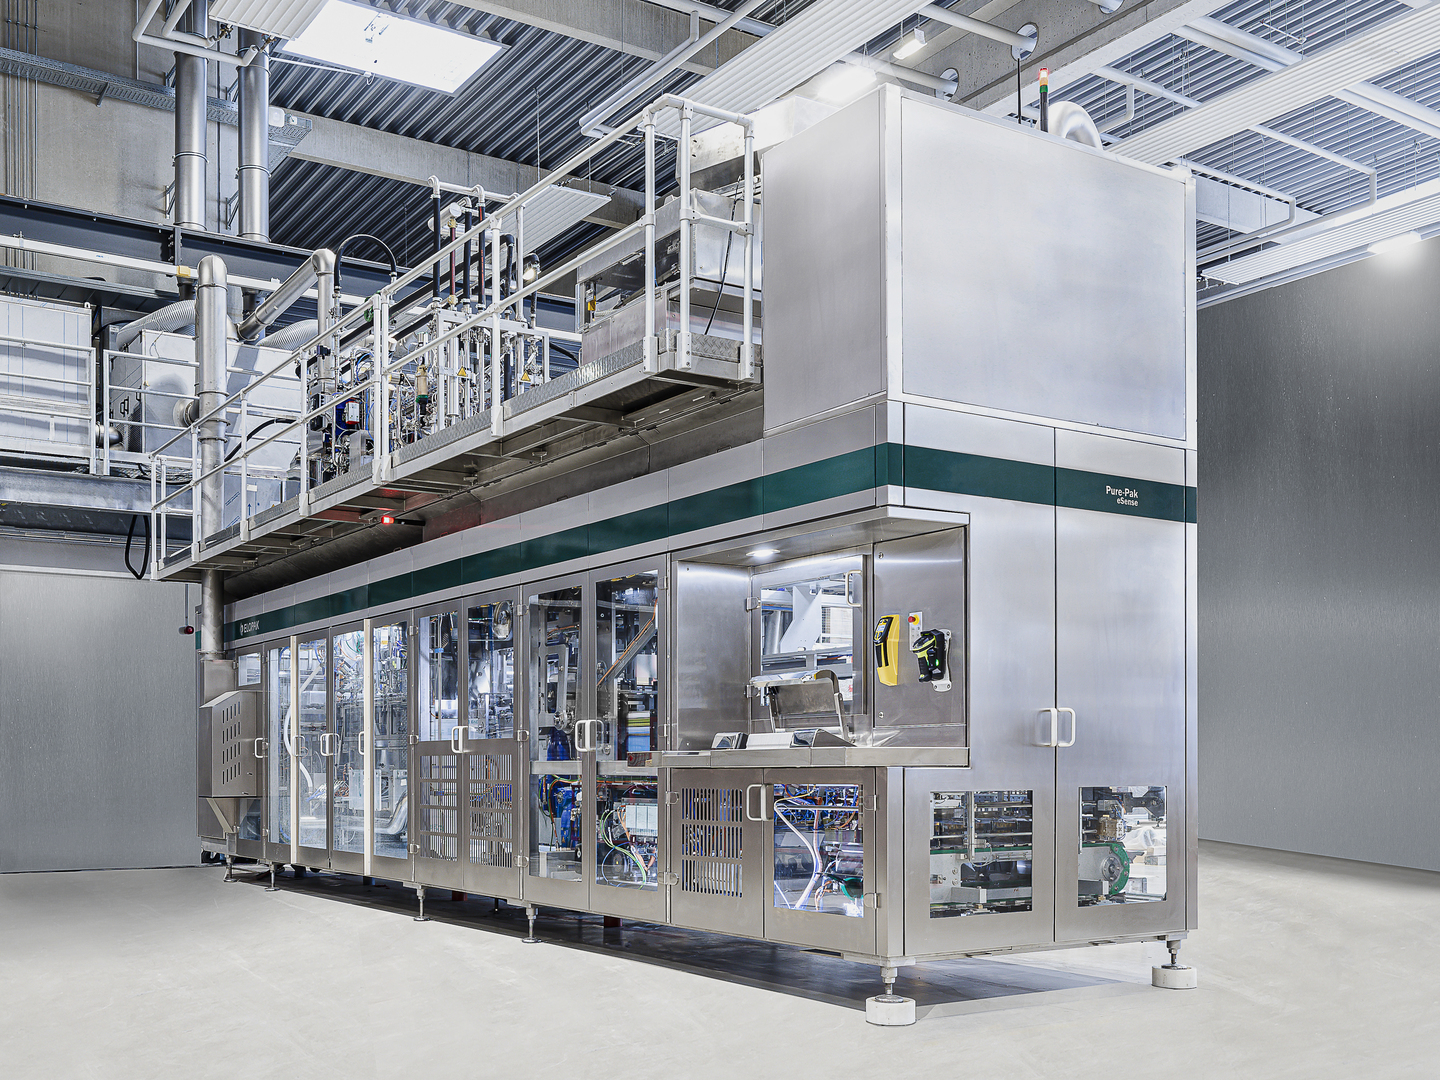
The machines feature a space-saving, compact design with a capacity of up to 14,000 cartons per hour in different formats and hygiene classes. They require minimal manpower and include the option of fully automatic material loading, offer exceptional flexibility, and have low utility consumption and operating costs. With the fastest possible change-over of format, design and volume, in addition to specially designed and proven filler valve models, the machines enable an extended product line ranging from non-carbonated soft drinks and liquid dairy products to medium and high viscous products.

Filling machines in operation
Elopak develops and offers a wide range of state-of-the-art filling machines for efficient filling of fresh, extended shelf life (ESL) and aseptic liquid food products. Our filling machines are suitable for many different food products and the machines can run a variety of package sizes for all our Pure-Pak® brands.
In 2022, emissions from filling machines in operation decreased by 46% compared to 2021 and 29% compared to 2020. The emissions are strongly correlated with the number of filling machines sold in the year. The number of machines sold in 2022 was lower than both 2021 and 2020.
Our machines come with different production capacities and will fill a wide range of pack sizes and shapes. In addition, machines are adapted and certified to meet various geographical standards.
We offer our customers research and development support during the entire project lifecycle, including the new package and product development, comprehensive after-sales services, technical training, and maintenance support.
